Input format and options
Mechismo requires a list of one or more proteins, which can be specified using most protein or accessions (UniProt, ENSEMBL, Gene symbols). If you wish to study mutations or post-translational modifications, you simply append these as either variants/mutants (e.g. R152C) or modifications (e.g. S88Sp, K75Ka where 'p' and 'a' represent phosphorylation or acetylateion) separated by a forward slash (/) or a space. Larger modifications can be specified (e.g. sumo, ubiq, nedd for SUMOylation, ubiquitination, neddylation) though be warned that these are treated simply as large changes to the site, and would invariably be predicted to disable any interaction.
You can provide additional information about sites or modifications by simply adding text (any format) after the protein/genes/sites information
above separated by a space. For example:
RASH_HUMAN/G12A Sample1
RASH_HUMAN/G12C Lung-cancer
RASH_HUMAN/G12D Sample2
RASH_HUMAN/G12E Sample2
RASH_HUMAN/G12S Control
On the default form there are also several options:
| Name your search | provide a name so that you can find your results easily in the future |
|---|---|
| Species | specify a species (only necessary if using gene names or ambiguous gene/protein identifiers) |
| Stringency | how restrictive to be when mapping sequences to structure (i.e. what is to be included in the output) |
| high: only consider known interactions (no orthologues) and very high sequence similarity to structures | |
| medium: consider interactions involving close homologues and moderate sequence similarity to structures | |
| low: consider interactions involving close homologues and any sequence similarity to structures | |
| all: consider all predicted interactions (using structure) and any sequence similarity to structures | |
| Example 1 | a set of H-ras mutations from Uniprot |
| Example 2 | a set of phosphorylations and acetylations in P53 and some of its interaction partners |
| Example 3 | a set of phosphorylations and acetylations from M.pnemoniae |
| Example 4 | a set of Medulloblastoma mutations within DDX3X |
| Search | execute the search |
| Clear | clear the form |
| Upload file | upload a file containing proteins/mutations/modifications and advanced options |
Stringency
This lets you select the quality of the data you use to make predictions. Two things are modified: 1) the quality of the structural matches used to model interactions, and 2) the underlying interaction evidence for protein-protein interactions.- High stringency will use only exact structures or very close homologues (70% or greater sequence identity), and only high quality protein-protein interactions (i.e. likely to be direct). For example, if you are searching with human proteins, then this setting will use human structures and probably mouse or other mammal structures, but most probably not Yeast or bacterial structures to model the interactions.
- Low stringency uses any structural matches and any interaction evidence, including interactions from other species, or those coming from indirect experiments (e.g. affinity purification data, etc.). As long as there is some evidence of an interaction between the proteins, and there is some kind of structure available to model them, this setting will show it to you regardless of how weak the interaction evidence is, or how low the sequence similarity to the structure is.
- Medium is in between: a bit more relaxed on both structure and interaction quality, but still more conservative than low stringency.
- Using all is a kind of last resort. This will show you any model of any interaction regardless of quality and (more imporantly) regardless of whether there is any evidence of an interaction at all. In other words, if there is a sequence match to a known structure, then this setting will show you an interaction.
The all setting is useful either if one has (say) a single variant or a few variants in one protein for which little is known and one is willing to consider new hypotheses about what the protein/positions might be doing. It is also useful when looking at Yeast or bacterial datasets when limited data are available (e.g.) for protein-protein interactions (see the Mycoplasma modification datasets in the Examples pages).
Note that these settings are different from the H,M,L in the confidences reported when predictions are made. These values (see below) are derived by considering the false-positive rate deduced from benchmarking and have to do with the quality of individual predictions rather than templates selected.
The main output page
After your job has finished, you will see an initial summary page that consists of several sections. At the top of the page (after a copy of your input in a collapsed input form) you will find two bar charts that count for both sites (i.e. protein positions, mutations or modifications specified) and for proteins overall the percentages and overall numbers in each category. To the left of these plots you will get a textual summary of the input and of what was found by the system from it.
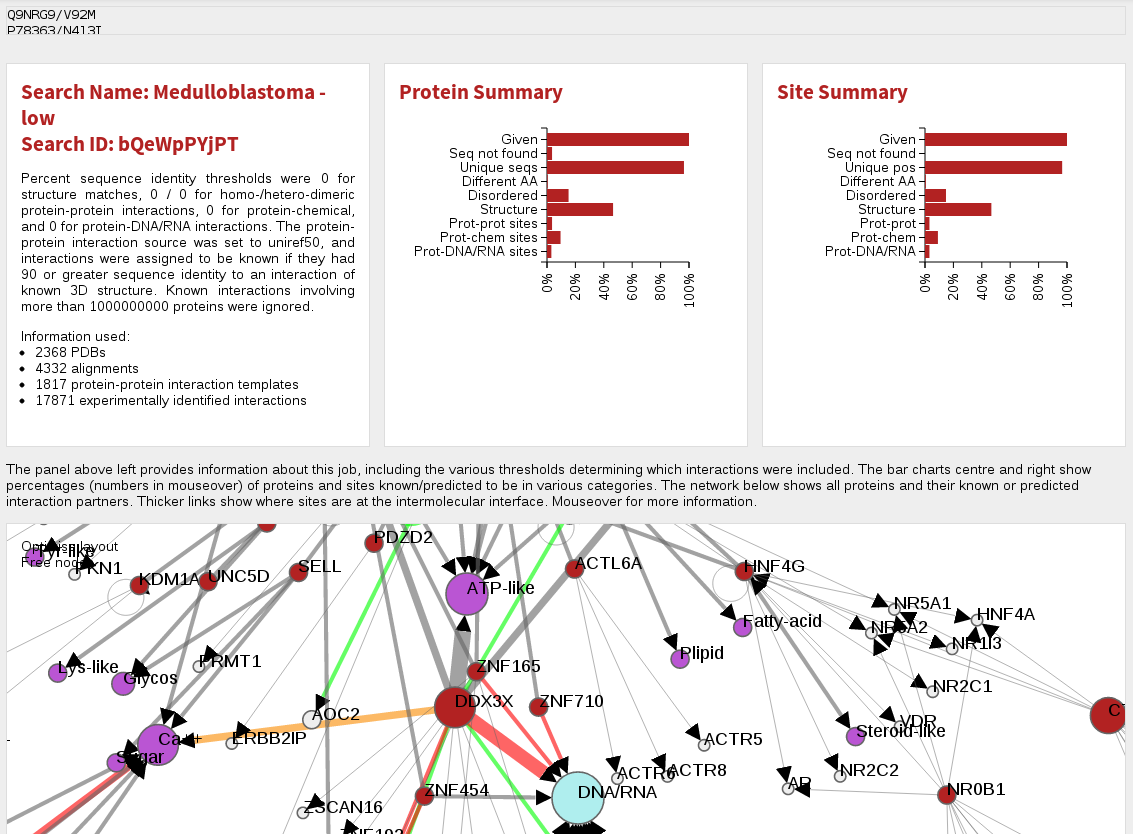
Below this is an ineractive network view of the data. Nodes (ie. circles) in this network are red for proteins given in the original search (usually mutated/modified proteins), grey for other proteins found to interact with them, magenta for chemicals and blue for DNA. Node sizes are proportional to the number of mutations/modifications in each protein. Links between molecules indicate a known or predicted interaction between them, and the thickness of the lines is proportional to the number of mutations/modifications predicted to affect the interation. For protein-protein interactions, very thin lines indicate interacting proteins for which no modifications are at the interface, and colours apart from grey indicate a positive (green), negative (red) or mixture (both positive and negative effects) for the modifications affecting the interaction.
You can navigate around this network by left-clicking and dragging in the X- or Y- direction. Your mousewheel or a double click should zoom you in/out and left-clicking on a node (ie. molecule) will let you re-position it as desired. Mousing over molecules or interactions gives you some information about it, and clicking on proteins will open a new page (see below) describing that protein and its interactions in more detail.
Below the network you are provided with tables that provide summary data for both proteins and each specified site (if given).
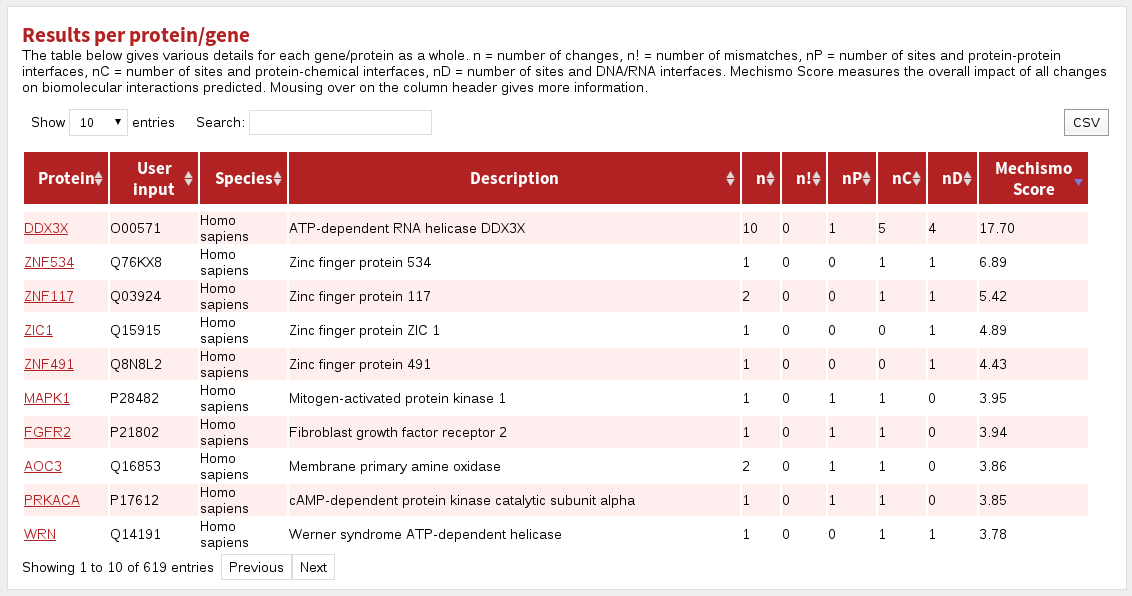
The columns in the Results per protein/gene table are:
| Protein | the name of the gene in the system |
|---|---|
| User input | the protein specification given during input |
| Species | the species for the protein |
| Description | the uniprot short description of the protein |
| n | the number of sites found in a protein |
| n! | the number of site mismatches (i.e. where the given residue was not the same as that found in the system) |
| nP | the number of sites at protein-interaction interfaces |
| nC | the number of sites at chemical-interaction interfaces |
| nD | the number of sites at DNA/RNA-interaction interfaces |
| Mechismo Score | Sum of Mechismo Scores for each site in this protein. The higher the Mechismo Score, the more likely a particular mutation or modification is to affect interactions with other molecules. Mechismo Score = the sum of (1 + maximum absolute change in pair-potential) for protein-protein, protein-chemical and protein-DNA/RNA interactions. |
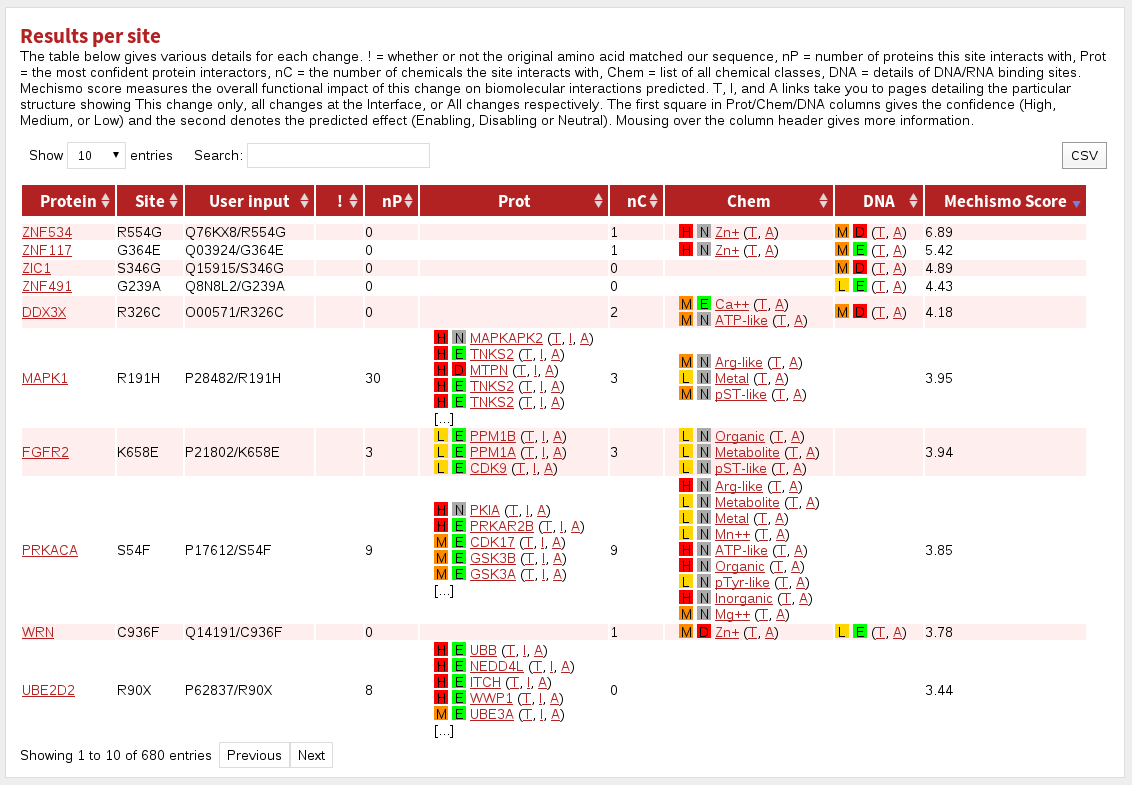
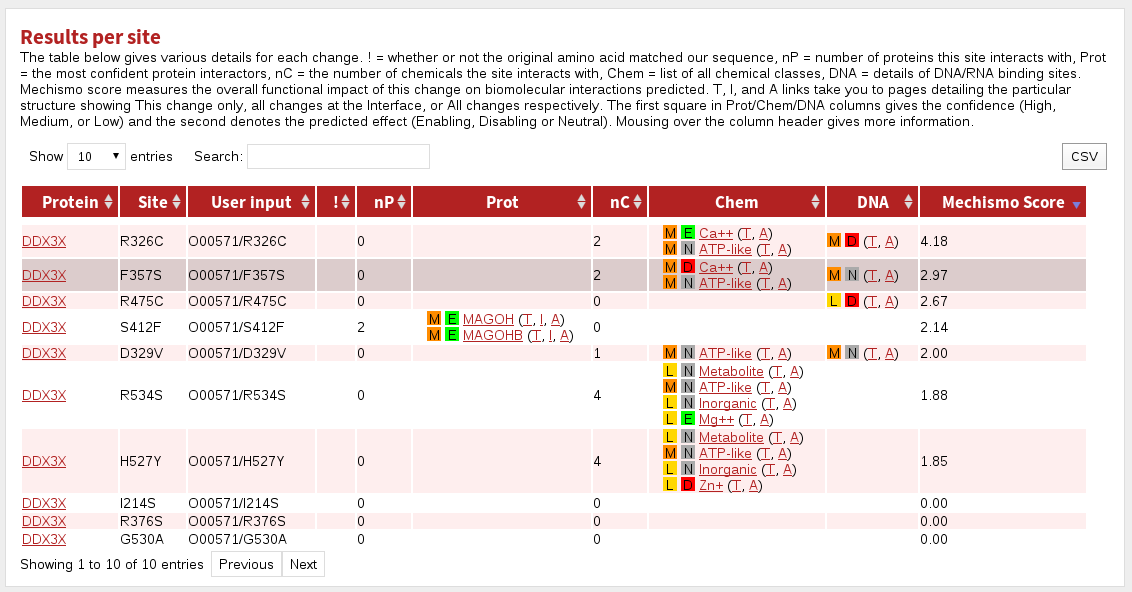
The table labelled Results per site gives a summary for each site in the dataset.
 The columns are:
| Protein | the name of the gene in the system |
|---|---|
| Site | the site referred to in this row |
| User input | the protein specification given during input |
| ! | indicates where the given residue was not the same as that found in the system |
| nP | the number of interacting proteins contacted by this site |
| Prot | the top five proteins (by sequence identity to the structural template) known or predicted to interact with this site |
| nC | the number of chemical classes with which this site interacts |
| Chem | the chemical classes with which this site interacts |
| DNA | indicates where the site is predicted or known to interact with DNA |
| Mechismo Score | The higher the Mechismo Score, the more likely a particular mutation or modification is to affect interactions with other molecules. Mechismo Score = the sum of (1 + maximum absolute change in pair-potential) for protein-protein, protein-chemical and protein-DNA/RNA interactions. |
The hyperlinks labelled (A, I, T) take you (in all tables) to a page showing the structure referred to. Clicking 'A' shows all sites given in the structure, 'I' shows all sites in the structure that are in contact with a molecule (if chemical, nucelic acid or protein is specified), and 'T' shows only the particular site referred to in the table cell.
Note that interactions are only accessible or counted if they satisfy the parameters you provided about how to find them. For more about how to tune the set of interactions shown, see Advanced options.
Coloured boxes with H, M or L indicate High, Medium or Low confidence predictions, respectively.
Coloured boxes with E, D or N indicate a prediction of the effect of the mutation/modification on the given interaction: Enabling, Disabling or Neutral, respectively.
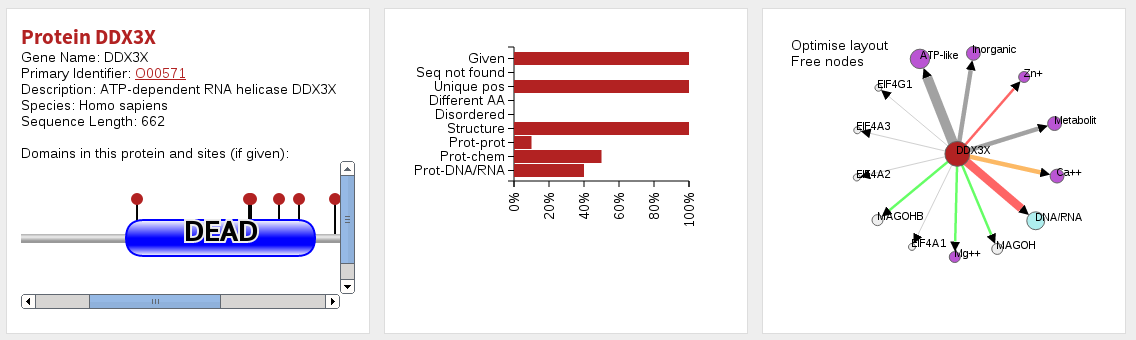
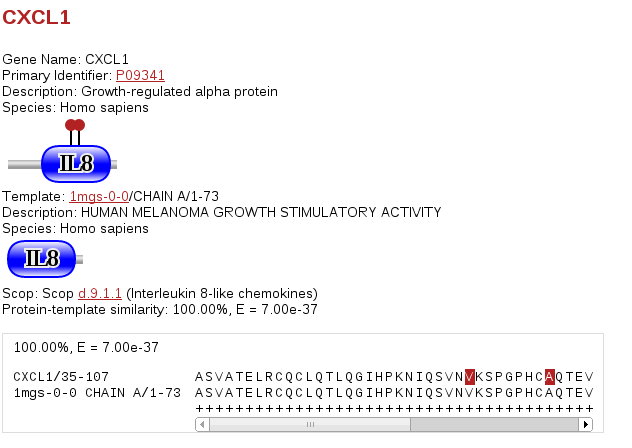
Protein specific pages
When you click on an individual protein (either via the network or tables in the main page) you are taken to a page specifically about that protein. At the top of this page you are given a summary of the protein and the sites given for it in three ways. First, to the left you will see a domain bubblegram highlighting the location of domains (Pfam) and the positions of sites provided. Mousing over parts of this diagram will tell you what the displayed features are. In the middle you are given a graphical summary of the number of sites in the protein, and the number/proportion of them that are in the various categories considered (e.g. disordered, in contact with a chemical, protein, nucleotide, etc.). On the right you will find a smaller network showing only this protein, and the molecules it interacts with (which is otherwise as for the network on the main page). Below this are four tables specific to this protein, which list sites lying in protein structures matched by the protein, in protein-chemical interactions, protein-DNA/RNA interactions and protein-protein interactions.
The table labelled Results per site is identical to the table on the main results page, save that it gives a summary for each site only for those sites in the protein selected.
 The columns in this table are:
| Protein | the name of the gene in the system |
|---|---|
| Site | the site referred to in this row |
| User input | the protein specification given during input |
| ! | indicates where the given residue was not the same as that found in the system |
| nP | the number of interacting proteins contacted by this site |
| Prot | the top five proteins (by sequence identity to the structural template) known or predicted to interact with this site |
| nC | the number of chemical classes with which this site interacts |
| Chem | the chemical classes with which this site interacts |
| DNA | indicates where the site is predicted or known to interact with DNA |
| Mechismo Score | The higher the Mechismo Score, the more likely a particular mutation or modification is to affect interactions with other molecules. Mechismo Score = the sum of (1 + maximum absolute change in pair-potential) for protein-protein, protein-chemical and protein-DNA/RNA interactions. |
The hyperlinks labelled (A, I, T) take you (in all tables) to a page showing the structure referred to. Clicking 'A' shows all sites given in the structure, 'I' shows all sites in the structure that are in contact with a molecule (if chemical, nucelic acid or protein is specified), and 'T' shows only the particular site referred to in the table cell.
Note that interactions are only accessible or counted if they satisfy the parameters you provided about how to find them. For more about how to tune the set of interactions shown, see Advanced options.
Coloured boxes with H, M or L indicate High, Medium or Low confidence predictions, respectively.
Coloured boxes with E, D or N indicate a prediction of the effect of the mutation/modification on the given interaction: Enabling, Disabling or Neutral, respectively.
The table labelled Sites with predicted chemical interaction structures shows sites predicted or known to be in contact with a small-molecule.
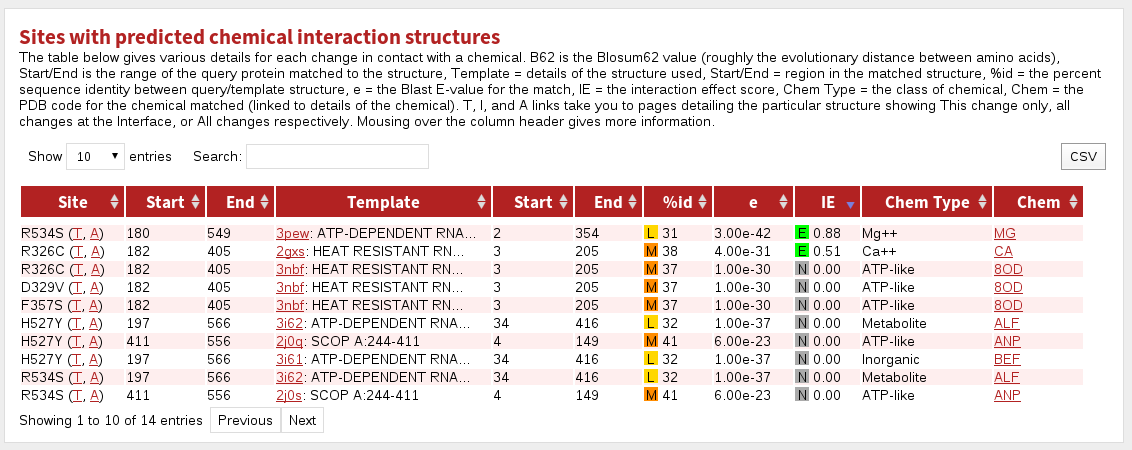 The columnns in this table are:
| Site | the site referred to in this row |
|---|---|
| Start | the first residue matching to known structure |
| End | the last residue matching to known structure |
| Template | the PDB code and the name of the protein stucture |
| Start | the first residue matched in the known structure |
| End | the last residue matched in the known structure |
| %id | the percent sequence identity between the protein and template structure. Coloured boxes with H, M or L indicate High, Medium or Low confidence predictions, respectively. |
| e | the BLAST E-value for the match |
| IE | Interaction Effect score. Coloured boxes with E, D or N indicate a prediction of the effect of the mutation/modification on the given interaction: Enabling, Disabling or Neutral, respectively. |
| Chem Type | the broad chemical class of the molecule |
| Chem | the PDB three-letter code for the chemical (clicking shows more info) |
The hyperlinks labelled (A, I, T) take you (in all tables) to a page showing the structure referred to. Clicking 'A' shows all sites given in the structure, 'I' shows all sites in the structure that are in contact with a molecule (if chemical, nucelic acid or protein is specified), and 'T' shows only the particular site referred to in the table cell.
Note that interactions are only accessible or counted if they satisfy the parameters you provided about how to find them. For more about how to tune the set of interactions shown, see Advanced options.
The table labelled Sites with predicted DNA/RNA interaction structures shows sites predicted or known to be in contact with a small-molecule.
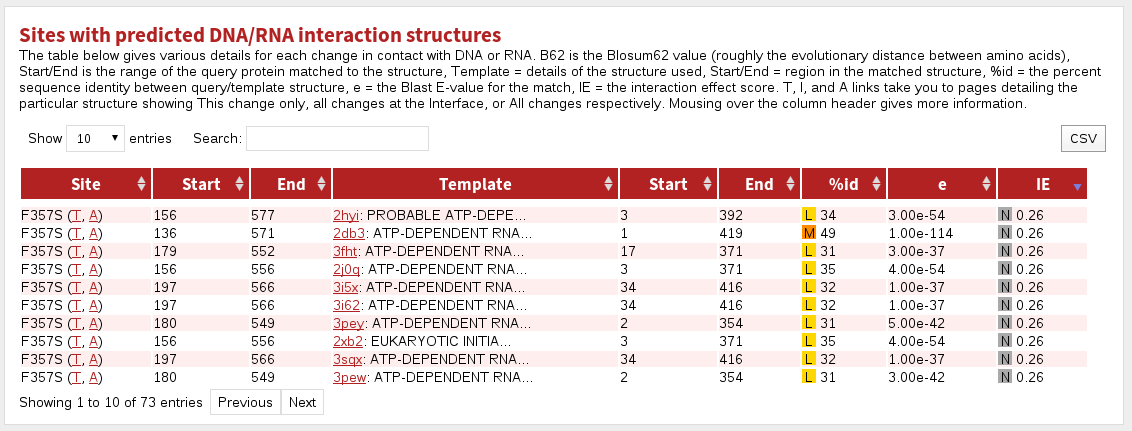 The columnns in this table are:
| Site | the site referred to in this row |
|---|---|
| Start | the first residue matching to known structure |
| End | the last residue matching to known structure |
| Template | the PDB code and the name of the protein stucture |
| Start | the first residue matched in the known structure |
| End | the last residue matched in the known structure |
| %id | the percent sequence identity between the protein and template structure. Coloured boxes with H, M or L indicate High, Medium or Low confidence predictions, respectively. |
| e | the BLAST E-value for the match |
| IE | Interaction Effect score. Coloured boxes with E, D or N indicate a prediction of the effect of the mutation/modification on the given interaction: Enabling, Disabling or Neutral, respectively. |
The hyperlinks labelled (A, I, T) take you (in all tables) to a page showing the structure referred to. Clicking 'A' shows all sites given in the structure, 'I' shows all sites in the structure that are in contact with a molecule (if chemical, nucelic acid or protein is specified), and 'T' shows only the particular site referred to in the table cell.
Note that interactions are only accessible or counted if they satisfy the parameters you provided about how to find them. For more about how to tune the set of interactions shown, see Advanced options.
The table labelled Sites with predicted protein interaction structures shows sites predicted or known to be in contact with another protein.
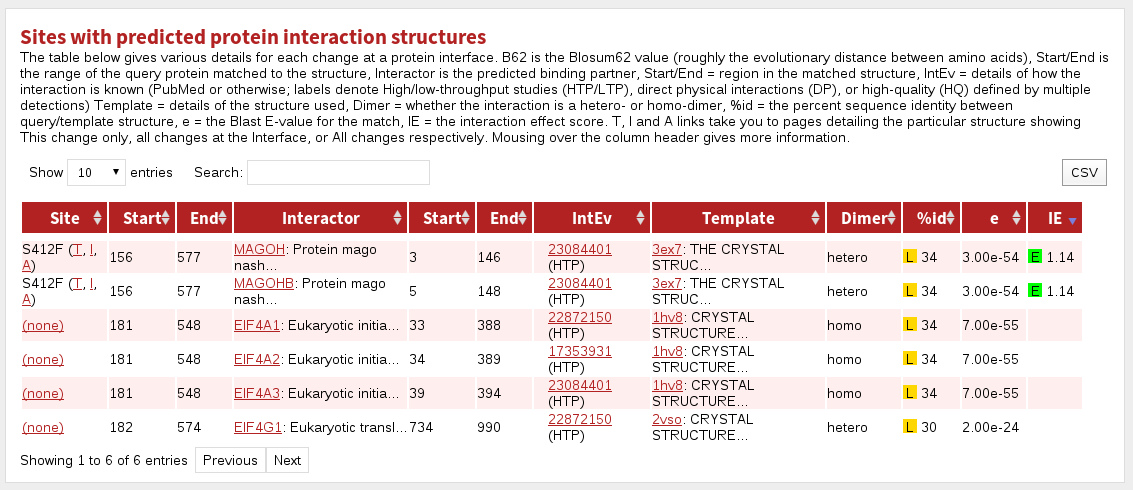 The columnns in this table are:
| Site | the site referred to in this row |
|---|---|
| Start | the first residue matching to known structure |
| End | the last residue matching to known structure |
| Interactor | the name of the protein interaction partner |
| Start | the first residue matched in the known structure |
| End | the last residue matched in the known structure |
| IntEv | interaction evidence given either as a PubMed id, 'Structure' to denote it was deduced by high similarity to a known structure, or 'Inferred' in the case that the interaction is not known, but there is nevertheless a structure on which to model it. |
| Template | the PDB code and the name of the protein stucture |
| Dimer | the dimer type: homo = homo/pseudo-homodimer; hetero = heterodimer |
| %id | the percent sequence identity between the protein and template structure. Coloured boxes with H, M or L indicate High, Medium or Low confidence predictions, respectively. |
| e | the BLAST E-value for the match |
| IE | Interaction Effect score. Coloured boxes with E, D or N indicate a prediction of the effect of the mutation/modification on the given interaction: Enabling, Disabling or Neutral, respectively. |
The hyperlinks labelled (A, I, T) take you (in all tables) to a page showing the structure referred to. Clicking 'A' shows all sites given in the structure, 'I' shows all sites in the structure that are in contact with a molecule (if chemical, nucelic acid or protein is specified), and 'T' shows only the particular site referred to in the table cell.
Note that interactions are only accessible or counted if they satisfy the parameters you provided about how to find them. For more about how to tune the set of interactions shown, see Advanced options.
The table labelled Sites in regions with any predicted structures shows sites matching to any known structure, regardless of whether that structure interacts with any other molecules.
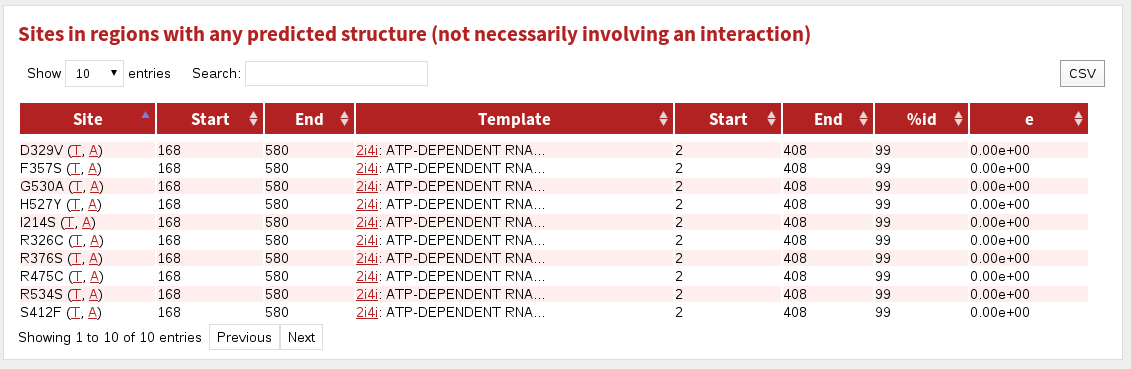 The columnns in this table are:
| Site | the site referred to in this row |
|---|---|
| Start | the first residue matching to known structure |
| End | the last residue matching to known structure |
| Template | the PDB code and the name of the protein stucture |
| Start | the first residue matched in the known structure |
| End | the last residue matched in the known structure |
| %id | the percent sequence identity between the protein and template structure |
| e | the BLAST E-value for the match |
The hyperlinks labelled (A, I, T) take you (in all tables) to a page showing the structure referred to. Clicking 'A' shows all sites given in the structure, 'I' shows all sites in the structure that are in contact with a molecule (if chemical, nucelic acid or protein is specified), and 'T' shows only the particular site referred to in the table cell.
Note that interactions are only accessible or counted if they satisfy the parameters you provided about how to find them. For more about how to tune the set of interactions shown, see Advanced options.
Structure pages
Clicking on any of the "(A, I, T)" links will take you to a page that shows much more detailed information about a single or a small selection of sites related to a single 3D structure. Proteins are summarised by domain bubblegrams showing the sites selected, and additional bubblegrams are shown for the protein of three-dimensional structure on which the interaction/site is modelled. Note that typically proteins of 3D structure contain smaller pieces or fragments of structure amenable to structure determination, so comparing these two bubblegrams should give you a feeling for how much of the query protein is present in the structure. Any matches to known structure are also accompanied by the percent sequence similarity between the query protein and the template and the associated BLAST E-value. There is also an alignment for the query/template proteins where the selected sites are marked. In the case of protein-protein interactions there are (of course) two sets of bubblegrams and two alignments.
Below the protein description, there is an interactive JSmol (Jmol) viewer showing the template protein structure with the sites selected labelled (in red) and interacting residues (for protein-protein interactions) shown in black labels. The query protein is coloured cyan and the interacting protein (if any) is shown in magenta. Proteins and nucleic acids are shown as C-alpha/backbone trace and any bound small-molecules are shown as ball-and-stick format and coloured by the CPK scheme (grey=carbon, red=oxygen, blue=nitrogen, etc.). Nucleic acids are coloured gold.
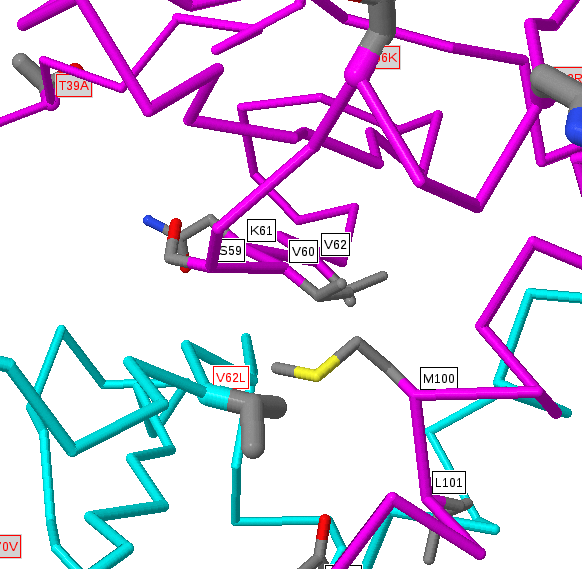
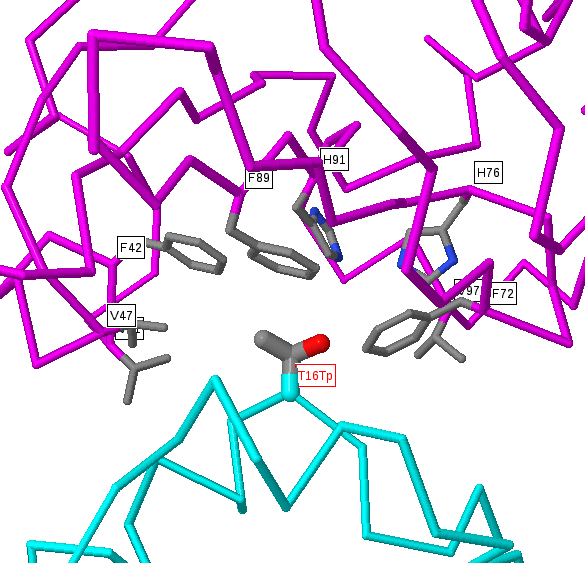
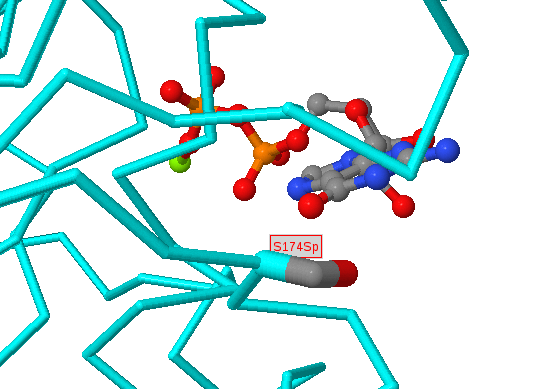
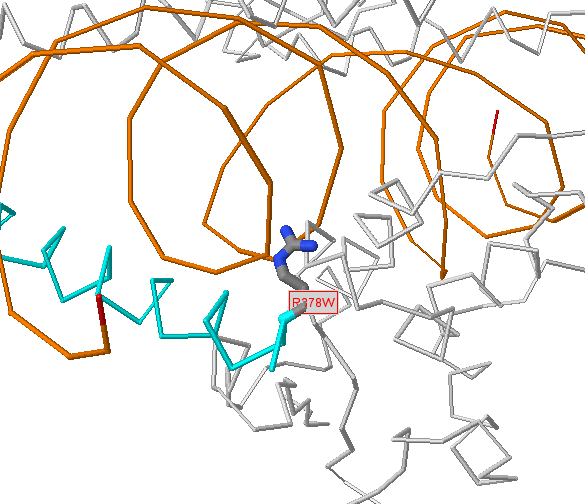
Within the structure, amino acids in the structure that are identical to those given as sites are shown in normal ball-and-stick format, with atoms coloured by the CPK scheme above. However, as we include structures whose sequences are non-identical to the protein of interest there can be disagreements between the residue in the protein of interest and the matched residue of known 3D structure. In these instances we colour the residues pink and only draw a limited number of side-chain atoms. The precise positioning of these residues would require careful modelling (and even then would often be inaccurate), but the approximate position (i.e. near to a bound chemical, protein or DNA) is normally trustworthy. For very low identity templates (e.g. <50% sequence identity) the alignment quality can be questionable, so it is important, when wishing to make deductions about a site predicted in a weakly matching structure, to inspect the alignment for (e.g.) many non-identical residues or insertions/deletions around the site of interest.
You can easily rotate these images by simply left clicking and dragging in an X or Y direction. There are a many other JSmol commands that you can find here.
Advanced options
Mechismo also accepts a set of text-options prior to any protein or positional information, which you can use to construct more specific queries than are available via the standard input form. Note that these take priority over any options selected in the input form. These are:
taxon=[number]
This specifies the NCBI Taxonomy id specific to the organism of interest. The current list is:| Taxon id | Common name | Species name |
|---|---|---|
| 9606 | Human | Homo sapiens |
| 10090 | Mouse | Mus musculus |
| 7227 | Fruit fly | Drosophila melanogaster |
| 6293 | Nematode | Caenorhabditis elegans |
| 559292 | Budding Yeast | Saccharomyces cerevisae |
| 272634 | M. pneumoniae | Mycoplasma pneumoniae M129 |
| 224308 | B. subtilis | Bacilus subtilis str 168 |
| 83333 | E. coli | Escherischia coli K12 |
min_pcid=[number between 0-100]
min_pcid_homo=[number between 0-100]
min_pcid_hetero=[number between 0-100]
min_pcid_chem=[number between 0-100]
min_pcid_nuc=[number between 0-100]
These are the minimum percent sequence identity thresholds to be considered when looking for proteins of known structure matching to query proteins. Note that in all cases the match between the two sequences was deamed to be significant by exact matches, BLAST or other sequence matching methods. The different values are for different types of matches. The first (min_pcid) is for matches to any known structure (irrespective of whether there is anything in contact or not). Values for min_pcid_homo and min_pcid_hetero specify thresholds for protein-protein interactions that involve homologous proteins (e.g. homo or psuedo-homo dimers) or sequence distinct (e.g. hetero dimeric) proteins.
known=[uniref100,uniref90,uniref50,none]
This parameter specifies how you wish to define what "known" interactions are. The most conservative setting is "uniref100" which specifies that interactions will only be shown if the exact proteins from the same species have been reported to interact. Specifying "uniref90" allows for some sequence differences (down to 90% identity) to be tolerated when looking for interactions, which is useful if one wants (e.g.) mouse interactions to suggest and interaction between human equivalents. Specifying "uniref50" is useful if one is looking in bacterial species or yeast or with sets of proteins for which very little is known (e.g. comparatively new discoveries or obscure proteins) and specifying "none" makes no requirement that an interaction be "known" to be reported - any match to a known structure (given the sequence identity thresholds above) will be reported. The latter is dangerous when looking at large datasets from human, but might be useful in situations with lower organisms or where little is known about a few proteins of interest.
min_pcid_known=[number between 0-100]
This value specifies the percent sequence identity above which (or equal to) an interaction between proteins is to be inferred purely on the basis of structure. Simply put, if you see a structure that is (say) 90% identity to a pair of proteins then it is very likely that this interaction will be real even if it is absent from interaction databases (and yes, this does happen).
known_max_n_prots=[integer]
This value allows one to filter interactions that are less likely to identify direct, physical, binary interactions. Essentially the system will ignore interaction source that identify at least this many proteins in one interaction.
known_direct_physical=[0 or 1]
This value allows one to include only those interactions from experiments likely to identify proteins that are in direct contact with each other (known_direct_physical=1)
known_htp=[0 or 1]
This value allows one to include interactions if they come from low-throughput sources (known_htp=0)
known_high_quality=[0 or 1]
This value allows one to include only 'trustable' interactions (known_high_quality=1) - those identified more than three times
Downloads
Downloads are available in JSON and TSV format. These give general information about sites (name, protein, disorder, mapped to structure, mapped to interactions) and specific information about each interaction, down to the residue level for protein-protein interactions.JSON
(Description and JSON schema to come.)TSV
The information in our TSV format files is designed to be easy to parse with grep and other line-based parsers. As such, some columns will be blank for some types of interactor and the contents of some columns are repeated in several rows (in particular columns 0-17).
Columns:General site information
- 00 - name_a1: gene name of query
- 01 - primary_id_a1: primary identifier of query (usually UniProt accession)
- 02 - id_seq_a1: internal database id of query sequence
- 03 - pos_a1: position in the query sequence
- 04 - res_a1: wild-type residue at that position
- 05 - mut_a1: mutated residue / PTM at that position
- 06 - user input: the input string that found this site
- 07 - mismatch: whether or not res1_a1 agrees with the user input
- 08 - blosum62
- 09 - iupred
- 10 - nS: whether or not the site was mapped to any structure
- 11 - nP: number of different proteins with which the site interacts
- 12 - nC: number of different chemical classes with which the site interacts
- 13 - nD: whether or not the site interacts with DNA/RNA
- 14 - mechProt: mechismo protein-protein score
- 15 - mechChem: mechismo protein-chem score)
- 16 - mechDNA/RNA: mechismo protein-DNA/RNA score
- 17 - mech: mechProt + mechChem + mechDNA
Info for interactor
- 18 - name_b1
- protein-protein interactions: gene name of interactor
- protein-chemical interactions: '[CHEM:type:id]'
- DNA/RNA interactions: '[DNA/RNA]'
- single-structure matches (i.e. no interaction): '[PROT]'
- 19 - primary_id_b1: primary identifier of query (usually UniProt accession)
- 20 - id_seq_b1
Template info and interaction evidence
- 21 - dimer: homo or hetero
- 22 - intEvLTP - interaction known from low-throughput evidence: true (1) or false (0)
- 23 - intEvHTP - interaction known from high-throughput evidence: true (1) or false (0)
- 24 - intEvStructure - interaction known from structure: true (1) or false (0)
-
25 - intEv - all interaction evidence: in JSON format list of hashes with the following fields
- pmid - PubMed identifier
- sources - source databases from which the interaction was extracted
- n_seqs - number of sequences involved in this interaction
- methods - experimental methods given as identifiers from the PSI MI ontology but with preceding zeros removed (eg. '4' = 'MI:0004');
- htp - High ThroughPut study: true (1) or false (0)
- dp - Direct Physical interaction: true (1) or false (0)
- hq - High Quality interaction: true (1) or false (0)
If all of 22-25 are false then the interaction is implicitly 'inferred from structure'.
- 26 - conf: confidence in the structural template
- 27 - ie: interaction effect for all contacts of the site with this interactor
- 28 - ie_class: class of interaction effect
- 29 - pos_b1: position in interactor sequence
- 30 - res_b1: residue at that position
- 31 - id_hit: unique id of query-template match
- 32 - idcode: pdb identifier of template structure
- 33 - assembly: biounit assembly number (= 0 if directly from pdb)
Info for template matched to query
- 34 - pcid_a: %identity between a1 and a2 sequences
- 35 - e_value_a
- 36 - model_a2: biounit model number (= 0 if directly from pdb)
- 37 - pos_a2: position in the template structure sequence
- 38 - res_a2: residue at that position
- 39 - chain_a2: PDB chain identifier
- 40 - resseq_a2: PDB residue sequence identifier
- 41 - icode_a2: PDB insertion code
Info for template matched to interactor
- 42 - pcid_b
- 43 - e_value_b
- 44 - model_b2
- 45 - pos_b2
- 46 - res_b2
- 47 - chain_b2
- 48 - resseq_b2
- 49 - icode_b2
Mechismo was developed by Matthew Betts, Rob Russell and others in the Russell Lab.

© 2014-2022, Heidelberg University